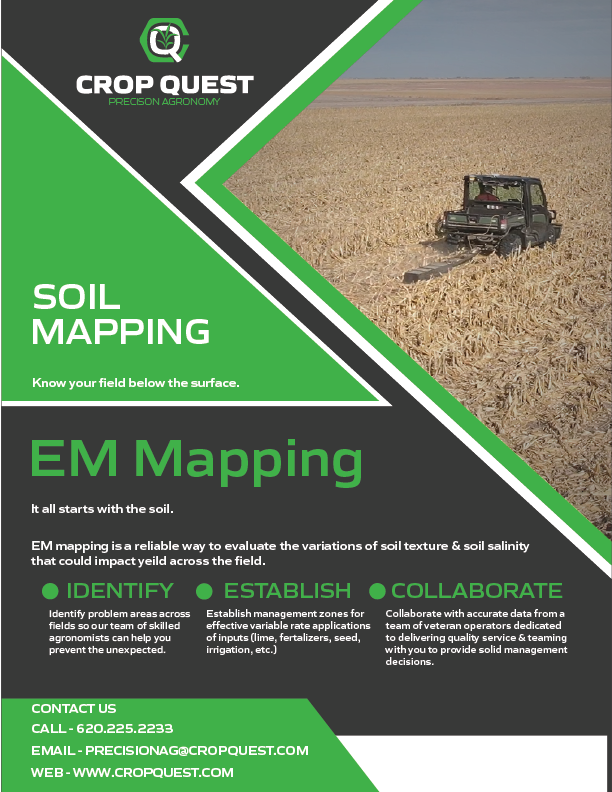
EC & EM SOIL TEXTURE MAPPING

Veris EC Mapper
EC mapping for soil texture and salinity. Coulters penetrate the soil measuring the soils ability to conduct electricity. Multiple rigs are available, some of which are capable of sensing EC, pH and OM at the same time.
EM38 & DualEM Mapper
Capable of salinity and soil texture mapping through a range of field conditions. The EM38 & DualEM work in work in dry, frozen and heavy straw conditions. In fact, they require no soil contact, only a consistent height and precise calibration.
Long Term Thinking Yields Dividends
It all starts with the soil. It takes about 300 years to form 3/8 inch of soil in a mild climate. The soils we farm were formed over thousands of years, and if managed well that same soil will be around for generations to come.
Soil texture does not change; which is why Veris EC or Geonics EM38 soil mapping are typically one time operations. Good or bad we can expect to farm the same soil texture as long as we remain stewards of that land.
“It makes sense to understand a resource that is relied on for a lifetime.”
Both Veris EC mapping and EM38 soil mapping leverage the soils ability to conduct electricity. The soils conductivity is related to the particle size, soil moisture, and salt content. By measuring and mapping the differences in the soil ec we can differentiate between soil textures, e.g. clay’s conductivity is higher than sands. Properly calibrated, these soil sensors are also capable of mapping variations in soil salinity.
The soil affects everything, from seed to fertilizer to herbicides. A one time investment in soil texture mapping gives a better understanding of the crops underlying resource. This information has the potential to yield dividends year in and year out because the layer has no expiration date.
![]()
Setting the Pace
New technologies are being introduced every day. A trend that will likely continue to pick up speed as we find more uses for layers like EC, and acquire layers such as crop health imagery.
EC & EM soil mapping both provide a consistent layer which can be used to create management zones for variable rate seeding, fertilizing, and irrigation. We have experience with these soil sensors and the expertise needed to incorporate them into your farming operation.
Maximizing Input Efficiency with Soil Mapping
Combining EC & EM soil mapping with producer / crop consultant knowledge and options are revealed for variable rate application of seed, fertilizer, and water. By optimizing the placement of inputs, the potential for a return on investment improves. The opposite can also be said. By not placing inputs in areas with poor soil, dollars can be saved or shifted to other locations. In short, good input placement leads to higher farm profits.
Your Soil, Your Data, Your Choice
Simply put, the data collected is the clients. The variable rate prescriptions generated go where you decide to send them. In other words, as an independent crop consulting company we make every effort to advance the farmers objectives.
Knowledge Base

EC Soil Mapping measures the soils electrical conductivity. Sands have low EC numbers and clays have high EC numbers. Running EC on a field results in a map showing differences in soil textures.
Soil Type takes into account more than just the soil texture. As a result, don’t expect the two to be exactly the same. EC Soil Mapping and soil type both have strengths and weaknesses depending on the use.
On a broad scale, a visual comparison of EC and soil type typically show areas of similarity.
Zooming in though you will discover there are differences. EC measurements are captured at a finer scale than soil type. As a result, soil texture mapping has improved detail. USDA order 2 soil surveys allow for 2.5 – 4 ac inclusions. Inclusions are small areas of differing soil that get swallowed up in larger groups of soil. The images above show potential inclusions and the differences between EC and soil type.
Basing variable rate prescriptions on soil type is a step in the right direction. But, think of it as a starting point for management zones. Long term, you’ll likely find it beneficial to improve the placement of inputs with the detail soil texture mapping can provide.

Veris EC soil mapping is collected at one point each second, at 10 MPH that is about one point every 15 ft. EM soil mapping collect more points per second than Veris EC rigs, meaning you will have multiple points in the same 15 ft. That is a good thing, but not as important in determining the level of detail as swath width.
Swath width is the other factor that improves point distribution. The smaller swath width results in more passes. Thus a better distribution of points.
Each of these images contain the same number of points. The difference is the swatch width. The smaller the swath width, the more you fill in the gaps between passes, the higher the detail. The result is a more robust layer for creating management zones.