 Having an Ace up your sleeve in a card game might get your arm broke, but having one in the game of risk management might just keep you from going broke. The Ace in the game of risk management I am referring to is in-season NDVI imagery. Crop Health Imagery from satellites provide a valuable problem monitoring tool for growers and crop consultants alike.
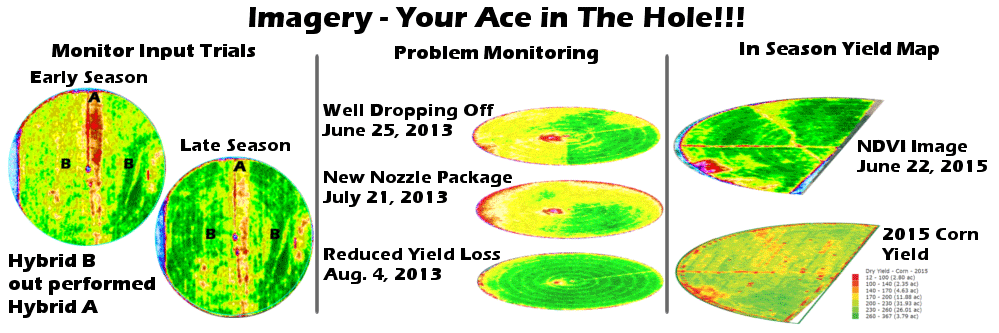
Through NDVI imagery, stress is detectable up to two weeks before it is visible to the naked eye. This advantage allows growers to be proactive instead of reactive. Crop health images are not the final solution, but they do point out where to go look to figure out the solution. A proactive approach to stress management will limit the yield loss and increase your bottom line.
Situations where wells are dropping off, nozzles are clogged, or fields aren’t draining properly can result in large portions of fields being affected. Sometimes these issues aren’t discovered until you are in the combine. At that point, it’s too late. Having a problem monitoring tool like Smart Pivot Monitoring that is continuously scanning your fields allows you to go about your normal operation. You no longer worry about if there is something going on in one of your fields that you aren’t aware of.
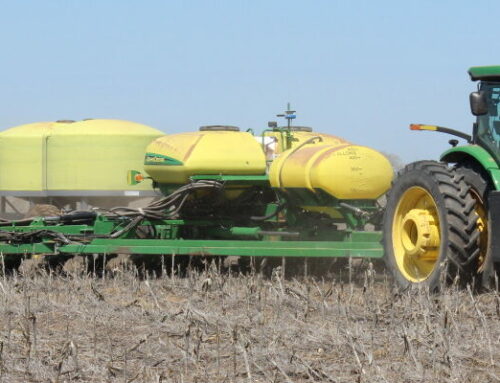
NDVI imagery can also be a valuable tool for figuring out where to place inputs or to assess how Variable Rate (VR) plans are working. Herbicide, seed, fertilizer, growth regulators, and defoliants are the most common inputs for VR applications based on crop health imagery. In-season applications of fertilizer have become standard practice. Identifying where levels of fertility are lacking or abundant and applying nutrients accordingly can improve nutrient uptake efficiencies that will result in an increase on your bottom line.
Input trials are also becoming a common theme on most grower’s farms. In the past, the only way to judge how one input did versus another was to look at yield differences at the end of the season. Through NDVI imagery, input trials can be monitored throughout the season. They can even be compared to previous seasons through archived satellite images. Looking back at past seasons shows trends and helps identify issues that could be carrying over, and affecting the current seasons crop. Previous farming practices and certain herbicide applications are two items known to carry over and affect crops across multiple seasons.
Yield Analysis is often referred to as the seasonal report card for a field. Why wait until the end of the season to know if your field is going to pass or fail? NDVI imagery can be your in-season report card. Yield maps and early season imagery have been found highly correlated. Having this early season report card provides an advantage that can ensure your fields will yield a passing grade every year.
Talk with your Crop Quest Agronomist about how you can best take advantage of in-season imagery.
Written by: John Gibson; Dodge City, KS